Business Reporting
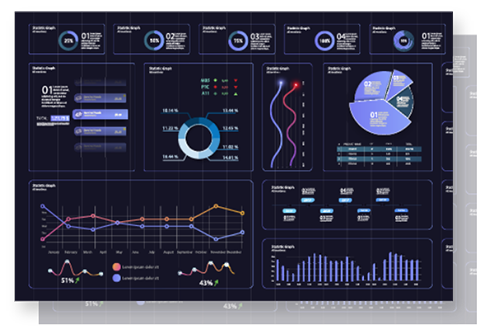
Access up to date, always available business reports that make sense and are easy to read with our Business Intelligence (often referred to as "BI") service.
Why is Business Intelligence becoming more popular?
Current and relevant data is an essential asset for any business and traditionally the only reports available have out of date data often in a difficult to read format.... not to mention the reports are hard to share and only include data from one system. With the use of tools like Microsoft's Power BI, the team here at IT Simply can set up relevant reports with readable dashboards that can show the data relevant to the person reading them. This means that you could have an Individual dashboard, Manager’s dashboard, Board dashboard and Shareholders dashboard all using the same data but shown in different ways. You can also have alerts to advise you of spikes in sales, operations or other relevant activities in a timely manner. This reporting really does take the complexity out of understanding your numbers.
We find many businesses have all of the information they need but it is in multiple systems, spreadsheets and outside sources. Our team are able to bring information from all of these sources and set up dashboards and reporting that reveals trends, comparisons, performance, budget vs performance and more. With each client, our team wants to know what is important to them individually and from this, create a powerful reporting platform.
Power BI Experts
Practice Intelligence
Board Reporting
Health & Safety Reporting
Management Reporting
Customised Insights
What can you Report on?
What can you use business reporting for?
- Day to day running of your business
- Division, department and branch reporting and comparisons
- Real time observations of KPI's, budgets and other business goals
- Board dashboards that can include business performance, health and safety data, trends and other information
- Tracking projects and progress
- Trend comparison of business performance by month and year
- Gathering data from multiple platforms and reporting on it in real time
- Multi level reporting based on the individuals role and access
- Sharing important data and trends to multiple people in multiple locations and business units.


Bring details to life
For the analyst at heart, Power BI Desktop provides a free-form
canvas for drag-and-drop data exploration as well as an
extension library of interactive visualizations, simple report
creation, and fast publishing to the Power BI service.
Evidence based decisions
Data should empower, not overwhelm. With Power BI, you can easily interact with your data, using simple drag-and-drop gestures to discover trends and natural language queries to get lightning-fast answers.


Share a world of insight
Always be in the know with the Power BI app for windows, iOS and Android. Alerts will inform you about any changes in your data so you can work with your team to take immediate action.
Grant
Grant Hartley-Brown
Grant’s passion is bringing real time data to life in an understandable, visual and readable way. It is not always what you want to know, it is why you want to know it and what you want to do with it that counts. Grant enjoys exploring what information is available, how it relates to other business metrics and the best way to present that information for best effect. To understand how business intelligence will work for you, please contact us today.
Improve your business with IT Simply
Help our team understand what you need, so we can provide you with the right tools to run your business effectively